Java Tools Tutorials - Herong's Tutorial Examples - v6.24, by Herong Yang
jconsole - Connecting to a Local JMX Agent
This section provides a tutorial example on how to run 'jconsole' to connect to a JMX agent running on a local machine, and how to monitor the running Java application by reading head memory usage, CPU usage, number of threads and classes.
If you follow the tutorial presented in the previous section, the PrimeNumberSeeker.java is running in a JVM with the default JMX agent turned on.
Now we can run "jconsole" to connect to this JVM to monitor how my PrimeNumberSeeker.java is running in two ways:
1. Find out the PID (Process ID) of this JVM and use the "jconsole <pid>" command to start "jconsole" and connect to this JVM on the local machine.
2. Use the "jconsole" command to start "jconsole". It will search for any JVM process that has the local JMX agent turned on. You can make the connection by clicking the search result list.
Obviously, the second way is better, because I don't have figure out the PID of my running JVM process. Here what I did to run "jconsole" and connect it to the JVM that runs PrimeNumberSeeker.java:
1. Run "jconsole" command. The connection window shows up with 2 JVM listed in the local processes section:
Name                                        PID

jdk.jconsole/sun.tools.jconsole.JConsole   2204
PrimeNumberSeeker                           736
2. Double click the name "PrimeNumberSeeker", the Java Monitoring & Management Console window shows with the Overview tab opened as shown in the picture below:
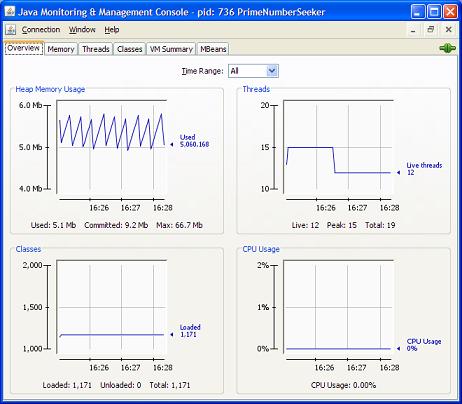
Cool. "jconsole" automatically collects some basic statistics like: heap memory usage, number of threads, number of classes, and CPU usage.
Table of Contents
javac - The Java Program Compiler
java - The Java Program Launcher
jpackage - Binary Package Builder
javadoc - The Java Document Generator
jdeps - The Java Class Dependency Analyzer
jdeprscan - The Java Deprecated API Scanner
jcmd - The JVM Diagnostic Tool
►jconsole - Java Monitoring and Management Console
JMX Technology and jconsole Tool
jconsole - Command Options and Connection Window
com.sun.management.jmxremote - JMX Agent for Local Connection
►jconsole - Connecting to a Local JMX Agent
com.sun.management.jmxremote.port - JMX Agent for Remote Connection
jconsole - Connecting to a Remote JMX Agent
jstat - JVM Statistics Monitoring Tool
jhsdb - The Java HotSpot Debugger
jvisualvm (Java VisualVM) - JVM Visual Tool
javap - The Java Class File Disassembler
keytool - Public Key Certificate Tool
jrunscript - Script Code Shell
native2ascii - Native-to-ASCII Encoding Converter