Java Tools Tutorials - Herong's Tutorial Notes - Version 5.32, by Dr. Herong Yang
Viewing a Heap Dump File
This section provides a tutorial example on how to view a heap dump file with Java VisualVM. It allows you to see list of classes with object counts and total sizes.
Java VisualVM can also be used to view a heap dump file created previously by Java VisualVM or other Java tools.
1. Run Java VisualVM.
2. Click "File > Load..." menu. Find and load the heap dump file, heap_dump.hprof, created in the previous tutorial.
3. Click the Classes tab.
A list of all classes is displayed with their objects and total memory sizes
as shown below:
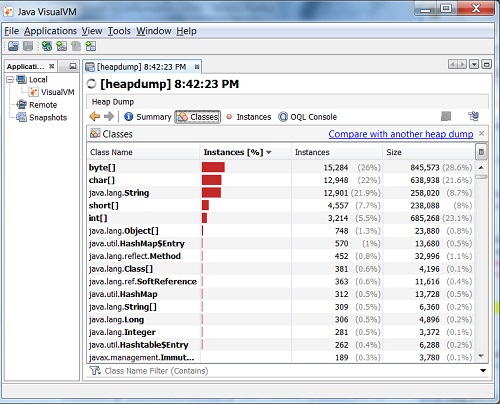
4. Find the java.lang.String class, which has 12,901 objects (instances) and uses 8.7% of the heap memory.
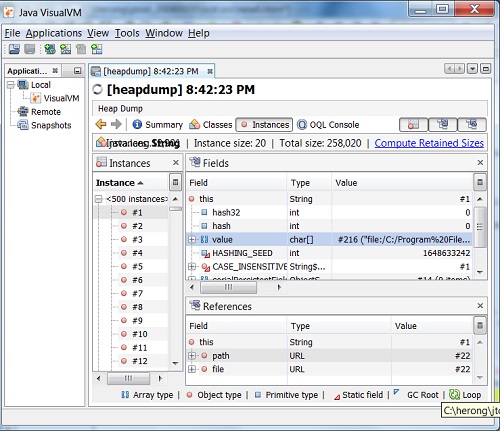
5. Double-click on java.lang.String to list all objects of this class. Java VisualVM switches the Instances tab with detailed info of the first object.
6. Find the "value" in the Fields panel.
You see this java.lang.String object contains "file:/C:/Program%20Files/Java/jdk1.8.0/..." as shown below:
Last update: 2015.
Table of Contents
'javac' - The Java Program Compiler
'java' - The Java Program Launcher
'jconsole' - Java Monitoring and Management Console
'jstat' - JVM Statistics Monitoring Tool
►jvisualvm (Java VisualVM) - JVM Visual Tool
What Is jvisualvm (Java VisualVM)?
jvisualvm Command to Open Dump Files or Conections
Connecting Java VisualVM to a Local JVM Process
Monitoring Usgaes of CPU, Heap, Classes and Threads
Monitoring Thread Status as Timeline
Taking Thread Dump to See Thread Stack Traces
Taking Heap Dump to See Memory Usages
Connecting to Remote JVM Processes
Avaible Plugins and Installation
'javap' - The Java Class File Disassembler
'keytool' - Public Key Certificate Tool