Java Tools Tutorials - Herong's Tutorial Notes - Version 5.32, by Dr. Herong Yang
Monitoring Usgaes of CPU, Heap, Classes and Threads
This section provides a tutorial example on how to use Java VisualVM to monitor usages of CPU, heap memory, classes and threads.
Once we have connected Java VisualVM to a JVM process, we can monitor its usage of CPU, heap memory, classes and threads.
1. Start Java VisualVM and connect to the running JVM of LongSleep.java.
2. Click on the Monitor tab. The monitor screen is displayed with 4 history diagrams:
- CPU Usage - Two lines are displayed: one represents the total CPU usage of the JVM and the other represents the GC activities within the JVM.
- Heap Memory Usage - Two lines are displayed: one represents the total reserved heap size of the JVM and the other represents the actual used heap size.
- Number of Classes - Two lines are displayed: one represents the total number of classes loaded and the other represents the number of shared classes.
- Number of Threads - Two lines are displayed: one represents the total number of threads and the other represents the number of daemon threads.
3. If we are only interested in the heap memory usage history,
we can close other diagrams by clicking the "x"
on the top right corner of each diagram.
Here is a picture of the heap memory usage history
of my LongSleep.java program:
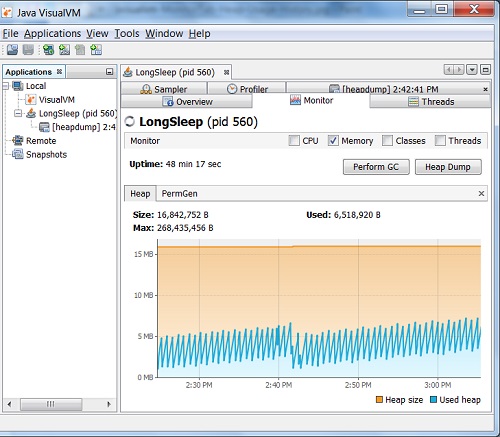
Note that the diagram showed a sudden drop of used heap size around 2:42, because I clicked "Perform GC" trigging a full GC on the JVM.
Also note that the diagram showed how used heap size was going up and down repeatedly due to partial GC activities. Since my main thread in LongSleep was sleeping, these partial GC activities were working on dead objects resulted from other threads in the JVM. Read the next tutorial to see more details.
Last update: 2015.
Table of Contents
'javac' - The Java Program Compiler
'java' - The Java Program Launcher
'jconsole' - Java Monitoring and Management Console
'jstat' - JVM Statistics Monitoring Tool
►jvisualvm (Java VisualVM) - JVM Visual Tool
What Is jvisualvm (Java VisualVM)?
jvisualvm Command to Open Dump Files or Conections
Connecting Java VisualVM to a Local JVM Process
►Monitoring Usgaes of CPU, Heap, Classes and Threads
Monitoring Thread Status as Timeline
Taking Thread Dump to See Thread Stack Traces
Taking Heap Dump to See Memory Usages
Connecting to Remote JVM Processes
Avaible Plugins and Installation
'javap' - The Java Class File Disassembler
'keytool' - Public Key Certificate Tool