Java Tools Tutorials - Herong's Tutorial Examples - v6.24, by Herong Yang
Monitoring Trigers on jmc JMX Console
This section provides a tutorial example on how to use JVM monitoring triggers provided by the MBean Browser on jmc JMX Console.
JMX console supports monitoring triggers, which allows to define and activate triggers to catch any specific condition of the JVM. Then raise alerts or fire other actions when the condition is met.
Here is what I did to use the triggers on JMX console:
1. Start "GarbageCollection.java" and "jmc".
2. Open the JMX console on the GarbageCollection JVM.
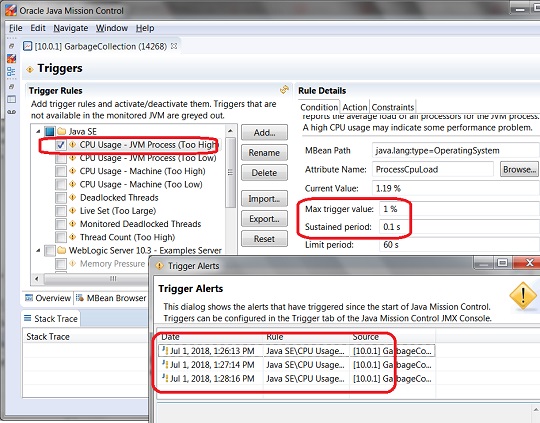
3. Click "Triggers" tab. I see a list pre-defined triggers.
4. Click to open the "CPU Usage - JVM Process (Too High)" trigger. I see its conditions, action and constrains.
5. Modify the condition to say that when this JVM process uses or higher 1% CPU for 0.1 second or longer, take action:
Max trigger value: 1 %
Sustained period: 0.1 s
6. Click the checkbox next to the "CPU Usage - JVM Process (Too High)" trigger to turn it on.
7. Wait to see alerts displayed with the above condition is met.
Of course, you can add your own triggers.
Table of Contents
javac - The Java Program Compiler
java - The Java Program Launcher
jpackage - Binary Package Builder
javadoc - The Java Document Generator
jdeps - The Java Class Dependency Analyzer
jdeprscan - The Java Deprecated API Scanner
jcmd - The JVM Diagnostic Tool
jconsole - Java Monitoring and Management Console
jstat - JVM Statistics Monitoring Tool
jhsdb - The Java HotSpot Debugger
jvisualvm (Java VisualVM) - JVM Visual Tool
jmc (Java Mission Control) - What Is It
Launching jmc (Java Mission Control)
jmc - JMX Console via MBean Server
MBean Browser on jmc JMX Console
►Monitoring Trigers on jmc JMX Console
javap - The Java Class File Disassembler
keytool - Public Key Certificate Tool
jrunscript - Script Code Shell
native2ascii - Native-to-ASCII Encoding Converter