JVM Tutorials - Herong's Tutorial Examples - Version 4.23, by Dr. Herong Yang
Method Area Growth with Dynamically Generated Classes
This section provides a tutorial example on how to force the Method Area to grow by creating classes dynamically with the Code Generation Library (CGLIB).
Another simple way to force the Method Area run out of memory is to create lots of new classes dynamically at the runtime. Here is a sample program provided by chaofanwei with some minor modifications:
/* MethodAreaDynamicClass.java
 * Based on a sample program from chaofanwei at
 * http://blog.csdn.net/chaofanwei/article/details/19483101
 */
import java.lang.reflect.Method;
import net.sf.cglib.proxy.Enhancer;
import net.sf.cglib.proxy.MethodInterceptor;
import net.sf.cglib.proxy.MethodProxy;
public class MethodAreaDynamicClass {
   public static void main(String[] args) {
      while (true) {
         Enhancer enhancer = new Enhancer();
         enhancer.setSuperclass(OOMObject.class);
         enhancer.setUseCache(false);
         enhancer.setCallback(new MethodInterceptor() {
            @Override
            public Object intercept
               (Object o, Method m, Object[] a, MethodProxy p)
               throws Throwable {
               return p.invokeSuper(o,a);
            }
         });
         enhancer.create();
      }
   }
   static class OOMObject {
   }
}
This programs the Code Generation Library (CGLIB) to run. So you need to download cglib-nodep-3.1.jar from http://sourceforge.net/projects/cglib/ to compile and run:
C:\herong>\progra~1\java\jdk1.8.0\bin\javac
   -classpath cglib-nodep-3.1.jar MethodAreaDynamicClass.java

C:\herong>\progra~1\java\jdk1.8.0\bin\java
   -classpath cglib-nodep-3.1.jar;. MethodAreaDynamicClass
Then go immediately to another command window to start "jconsole" to connect the MethodAreaDynamicClass process:
C:\herong>\progra~1\java\jdk1.8.0\bin\jps
10072 Jps
2860 MethodAreaDynamicClass

C:\herong>\progra~1\java\jdk1.8.0\bin\jconsole 2860
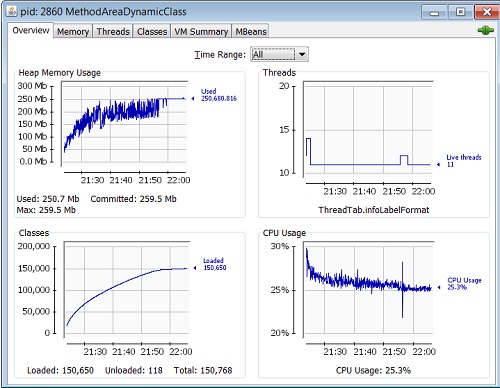
Now enjoy watching graphs on the growth of number of classes loaded, heap memory usage, and memory pool of "Metaspace". You can also check the growth of the JVM footprint using the "tasklist" command.
The following picture shows you the classes and Heap memory usage:
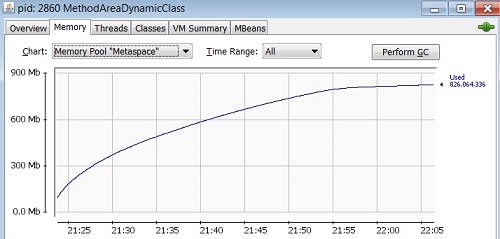
And the picture below shows you the Method Area (Metaspace) growth:
See the next section on the end result of the test.
Last update: 2014.
Table of Contents
Downloading and Installing JDK 1.8.0 on Windows
Downloading and Installing JDK 1.7.0 on Windows
java.lang.Runtime Class - The JVM Instance
java.lang.System Class - The Operating System
ClassLoader Class - Class Loaders
Class Class - Class Reflections
JRockit JVM 28.2.7 by Oracle Corporation
Method Area Expansion Demonstration
OutOfMemoryError on the Method Area
►Method Area Growth with Dynamically Generated Classes
Garbage Collection Issue with Dynamically Generated Classes
Interned Strings Stored in Heap
Direct Memory Expansion Demonstration
allocateMemory() Method on Direct Memory
JVM Stack Expansion Demonstration
PC Register and Native Method Stack
Memory Management and Garbage Collectors
JVM Stack, Frame and Stack Overflow
Thread Testing Program and Result
CPU Impact of Multi-Thread Applications
I/O Impact of Multi-Thread Applications
Micro Benchmark Runner and JVM Options
Micro Benchmark Tests on "int" Operations
Micro Benchmark Tests on "long" Operations
Micro Benchmark Tests in JIT Compilation Mode