JVM Tutorials - Herong's Tutorial Examples - Version 4.23, by Dr. Herong Yang
Garbage Collection Issue with Dynamically Generated Classes
This section provides a tutorial example that shows the JVM garbage collector is struggling to maintain the Heap data area with dynamically generated classes. It spends about 89% of the time doing MarkSweepCompact garbage collection.
While watching "jconsole" connected to the MethodAreaDynamicClass.java execution JVM, I saw the number of classes growing, which causes the size of the Method Area to grow as expected. But I also saw the Heap memory usage growing too. I am not sure why.
If both data areas are growing, we should soon get an OutOfMemoryError exception on the Method Area or on the Heap, right?
Wrong answer. The JVM continues to run for long time, and spends more and more time on garbage collection, and less and less time generating new classes.
Here is the summary of the JVM after 1 hour of the execution time:
Connection name: pid: 2860 MethodAreaDynamicClass
Virtual Machine: Java HotSpot(TM) Client VM version 25.0-b70
Vendor: Oracle Corporation
Process CPU time: 1 hour 16 minutes

Live threads: 11
Current classes loaded: 158,679
Total classes loaded: 158,857
Total classes unloaded: 178

Current heap size: 247,097 kbytes
Maximum heap size: 253,440 kbytes
Committed memory: 253,440 kbytes
Pending finalization: {0} objects

Garbage collector:
   Name = 'Copy', Collections = 28,712,
   Total time spent = 5 minutes

Garbage collector:
   Name = 'MarkSweepCompact', Collections = 4,464,
   Total time spent = 37 minutes

Tenured Gen Used: 178,978 kbytes
Metaspace Used: 855,895 kbytes
JVM footprint: 1,168,268 K
CPU usage: 25.1%
The picture below shows you the how the JVM struggles with the Heap area for the last 50 minutes.
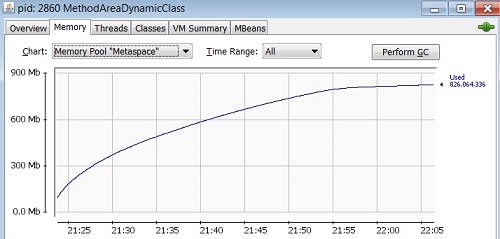
Conclusion: HotSpot 1.8 JVM memory management failed in this situation. It should throw an OutOfMemoryError exception, instead of spending most of the time doing garbage collection.
I guess I can let it run for another hour to see what will happen. So here is the summary of the JVM 1 hour later:
Connection name: pid: 2860 MethodAreaDynamicClass
Virtual Machine: Java HotSpot(TM) Client VM version 25.0-b70
Vendor: Oracle Corporation
Process CPU time: 2 hours 29 minutes

Live threads: 11
Current classes loaded: 170,737
Total classes loaded: 171,167
Total classes unloaded: 430

Current heap size: 244,837 kbytes
Maximum heap size: 253,440 kbytes
Committed memory: 253,440 kbytes
Pending finalization: {0} objects

Garbage collector:
   Name = 'Copy', Collections = 28,712,
   Total time spent = 5 minutes

Garbage collector:
   Name = 'MarkSweepCompact', Collections = 11,685,
   Total time spent = 1 hour 42 minutes

Metaspace Used: 937,404 kbytes
JVM footprint: 1,232,656 kbytes
CPU usage: 25.0%
Comparing with numbers collected earlier, I can see that:
- The total number of classes created is now 171,167, increased by 12,310.
- The Method Area size is now about 937 MB, increased by about 81 MB.
- The JVM footprint is now about 1,233 MB, increased by about 65 MB.
- The heap memory usage is 244 MB, 3 MB less than last time. So the garbage collector is able to keep it below the maximum heap size of 253 MB.
- But the total time spent by the MarkSweepCompact garbage collector during the last 73 minutes period is 65 minutes. So the JVM was spending 89% of the time do garbage collection!
I am guess is that the JVM will run out of memory on Method Area eventually. But I don't know how long it will take to get there.
Of course, if you want to see the OutOfMemoryError happening quickly, you can specify a low Method Area limit:
C:\>\progra~1\java\jdk1.8.0\bin\java -XX:MaxMetaspaceSize=256k
-classpath cglib-nodep-3.1.jar;. MethodAreaDynamicClass
Exception in thread "main" java.lang.OutOfMemoryError: Metaspace
   at java.lang.ClassLoader.defineClass1(Native Method)
   at java.lang.ClassLoader.defineClass(ClassLoader.java:760)
   at java.security.SecureClassLoader.defineClass(SecureClassLoade...
   at java.net.URLClassLoader.defineClass(URLClassLoader.java:455)
   at java.net.URLClassLoader.access$100(URLClassLoader.java:73)
   at java.net.URLClassLoader$1.run(URLClassLoader.java:367)
   at java.net.URLClassLoader$1.run(URLClassLoader.java:361)
   at java.security.AccessController.doPrivileged(Native Method)
   at java.net.URLClassLoader.findClass(URLClassLoader.java:360)
   at java.lang.ClassLoader.loadClass(ClassLoader.java:424)
   at sun.misc.Launcher$AppClassLoader.loadClass(Launcher.java:308)
   at java.lang.ClassLoader.loadClass(ClassLoader.java:357)
   at net.sf.cglib.core.KeyFactory$Generator.generateClass(KeyFact...
   at net.sf.cglib.core.DefaultGeneratorStrategy.generate(DefaultG...
   at net.sf.cglib.core.AbstractClassGenerator.create(AbstractClas...
   at net.sf.cglib.core.KeyFactory$Generator.create(KeyFactory.jav...
   at net.sf.cglib.core.KeyFactory.create(KeyFactory.java:116)
   at net.sf.cglib.core.KeyFactory.create(KeyFactory.java:108)
   at net.sf.cglib.core.KeyFactory.create(KeyFactory.java:104)
   at net.sf.cglib.proxy.Enhancer.<clinit>(Enhancer.java:69)
   at MethodAreaDynamicClass.main(MethodAreaDynamicClass.java:12)
Last update: 2014.
Table of Contents
Downloading and Installing JDK 1.8.0 on Windows
Downloading and Installing JDK 1.7.0 on Windows
java.lang.Runtime Class - The JVM Instance
java.lang.System Class - The Operating System
ClassLoader Class - Class Loaders
Class Class - Class Reflections
JRockit JVM 28.2.7 by Oracle Corporation
Method Area Expansion Demonstration
OutOfMemoryError on the Method Area
Method Area Growth with Dynamically Generated Classes
►Garbage Collection Issue with Dynamically Generated Classes
Interned Strings Stored in Heap
Direct Memory Expansion Demonstration
allocateMemory() Method on Direct Memory
JVM Stack Expansion Demonstration
PC Register and Native Method Stack
Memory Management and Garbage Collectors
JVM Stack, Frame and Stack Overflow
Thread Testing Program and Result
CPU Impact of Multi-Thread Applications
I/O Impact of Multi-Thread Applications
Micro Benchmark Runner and JVM Options
Micro Benchmark Tests on "int" Operations
Micro Benchmark Tests on "long" Operations
Micro Benchmark Tests in JIT Compilation Mode