Website Statistics - HerongYang.com - 2.95, by Herong Yang
Most Popular Operating Systems
The most popular operating systems based on browser signature strings in log files for year 2021 with 0 week of log files missing.
The following table shows the most popular operating systems for 2021 with 0 week of log files missing. Data used in this table come from the operating system report generated by Analog 6.0.11 CE using log files from herongyang.com.
  pages  %pages  OS
-------  ------  -------
5752788  34.62%  OS unknown
3271385  19.69%  Windows
2407208  14.49%    Windows 10 / Server 2016 / Server 2019
 600879   3.62%    Windows 7 / Server 2008 R2
 124428   0.75%    Windows XP
  61662   0.37%    Windows 8.1 / Server 2012 R2
  42707   0.26%    Windows Vista / Server 2008
  16055   0.10%    Windows 8.0 / Server 2012
  13395   0.08%    Unknown Windows
   2163   0.01%    Windows Server 2003
   1400   0.01%    Windows 95
3083302  18.55%  Android
2097720  12.62%    Android 6.0 (Marshmallow)
 303110   1.82%    Android 10.0
 242636   1.46%    Android 7.0 (Nougat)
 142548   0.86%    Android 11.0
  96603   0.58%    Android 9.0 (Pie)
  43843   0.26%    Android 8.1 (Oreo)
  40953   0.25%    Android 5.1 (Lollipop)
  34153   0.21%    Android 5.0 (Lollipop)
  24661   0.15%    Android 8.0 (Oreo)
  13516   0.08%    Android 7.1 (Nougat)
  10109   0.06%    Android 4.2 (Jelly Bean)
  10085   0.06%    Android 4.1 (Jelly Bean)
   9797   0.06%    Android 4.4 (KitKat)
   9129   0.05%    Unknown Android
   2194   0.01%    Android 12.0
   1642   0.01%    Android 4.0 (Ice Cream Sandwich)
2715363  16.34%  Known robots
 851693   5.13%  Apple
 421744   2.54%    macOS 10.15 (Catalina)
 268821   1.62%    macOS 10.10 (Yosemite)
  53777   0.32%    macOS 11.0 (Big Sur)
  35286   0.21%    macOS 10.14 (Mojave)
  22864   0.14%    macOS 10.11 (El Capitan)
  20422   0.12%    macOS 10.13 (High Sierra)
  10582   0.06%    macOS 10.12 (Sierra)
  10412   0.06%    macOS 10.6 (Snow Leopard)
   2298   0.01%    macOS 10.9 (Mavericks)
   1901   0.01%    macOS 10.7 (Lion)
   1641   0.01%    Macintosh
 625129   3.76%  iOS (Apple)
 209411   1.26%    iPhone (iOS 14)
 142251   0.86%    iPhone (iOS 10)
 139764   0.84%    iPhone (iOS 7)
  35362   0.21%    iPhone (iOS 15)
  32406   0.20%    iPhone (iOS 13)
  28671   0.17%    iPhone (iOS 11)
  15045   0.09%    iPhone (iOS 12)
   6865   0.04%    iPad (iOS 14)
   4570   0.03%    iPad (iOS 12)
   2411   0.01%    iPad (iOS 13)
   1377   0.01%    iPhone (iOS 4)
   1278   0.01%    iPad (iOS 15)
   1192   0.01%    iPad (iOS 9)
   1093   0.01%    iPad (iOS 10)
    966   0.01%    iPhone (iOS 9)
 305724   1.84%  Linux
 222321   1.34%    Unknown
  70354   0.42%    Ubuntu
  12333   0.07%    Fedora
  11069   0.07%  Chrome OS
   1027   0.01%  Unix
Comparing to year 2020, Windows' percentage value decreased from 31.35% to 19.69% in 2021. iPhone's and iPad's percentage value increased from 3.02% to 3.76%. Android's percentage value increased from 13.17% to 18.55%.
The following diagram shows the most popular operating systems of the last 10 years and their trends as of 2021. The numbers in the diagram represent percentages of pages views based on log files from website herongyang.com. The numbers are plotted on a logarithmic scale using the log(y+1) function.
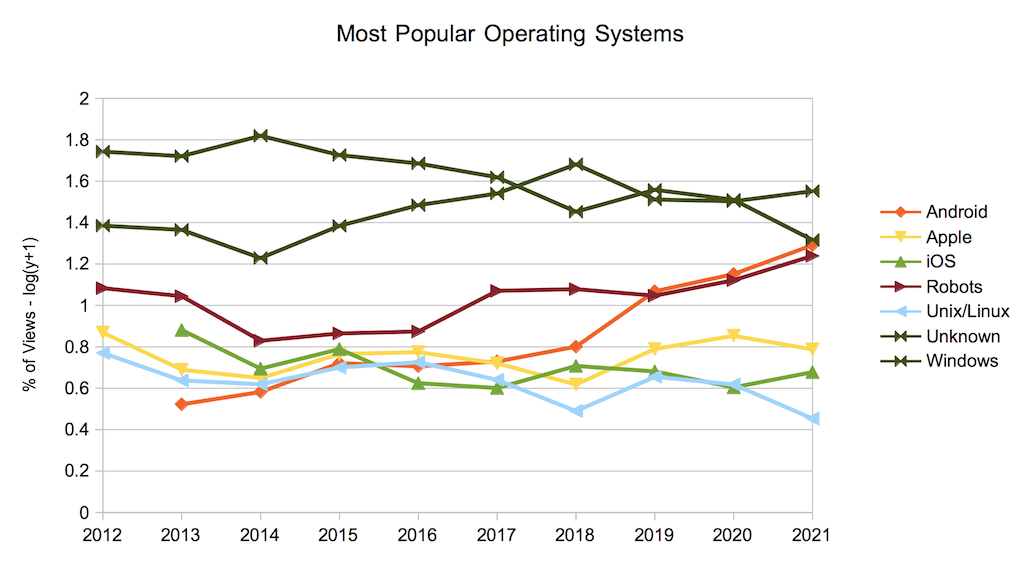
Table of Contents